BI views
Overview of the BI views for presenting data in the Business Intelligence view
Operating mode
Modules
Controlling & BI
In order to display the data in the Business Intelligence (BI) view, you must define BI views. These are located in the folder Settings > Business Intelligence > BI views:

Each of these BI views represents an evaluation in the BI module:

A BI view has the following properties:

Designation |
The designation of the evaluation is shown as the label of the buttons in the BI view. These are MLstring fields. |
Active |
Defines whether an evaluation is shown in the BI view. |
Icon |
In addition to the designation, an icon can be specified on the buttons. Valid are all Vertec Icons (index number) as well as the icon name. |
Group/Order |
The group is an integer. This allows you to group the buttons with which the BI shows are called up into groups. A group includes all BI shows that have entered the same group number. Within a group, the BI shows are sorted according to the specified order. If all buttons in a group have the same icon, it is shown in front of the group. |
Starting dimension |
Under Starting dimension, you can define the objects on which an evaluation is shown in the BI view.
|
Result dimension |
Here, you choose the class to be evaluated with this BI view. You can only select classes for which measures are available. |
Graph type |
Here, you can select how the evaluation is displayed. The following options are available:
You can set how the values are grouped in the different options under Horizontal grouping/Line grouping/Circle sectors below. |
Horizontal grouping/Line
|
Depending on the graph type selected, this section is called horizontal grouping (bar graph), line grouping (time series), or pie chart. Here, you can specify how the displayed values should be grouped. Based on the result dimension, the following options are available:
|
Measures
On the Measures page, you can predefine which BI measures you want to display:
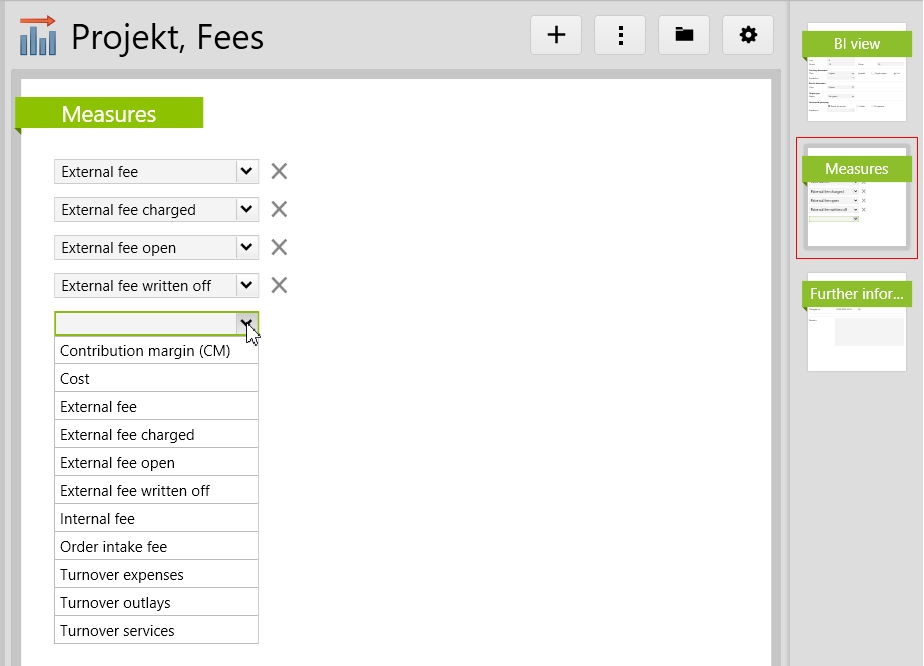
If this view is opened in the BI, these measures are automatically preselected:

Any other measures can be added.
If the current user does not have user rights for any of the predefined measures, the BI view is hidden.