
Evaluations in Vertec: Three Way to Improve Your Controlling
If you keep an eye on your performance values, you have already laid the foundations for efficient controlling. What are the different options for presenting key measures in evaluations in Vertec? In this article, I will discuss three options and present them to you by way of example.
Option 1: Evaluate measures on a list-based basis
Based on existing values, Vertec allows you to show key measures in lists. This can be done by any object you use in Vertec, such as address, projects, or user. For example, to obtain the contribution margin of a project, you can use a list to evaluate the invoice amount that you charge the customer as an external fee, as well as the actual costs per hour incurred by you.

In Vertec, you can define individual columns as evaluations and subsequently expand them as desired. Within the lists, it is possible to set up search filters, such as by user or customer, and to store these filters as a fixed selection option in the list. Individual columns can be assigned with background colors and simplifies controlling.
If you define reports for individual employees, the employee will only see the lists that you define. For example, he can see an overview of all projects for a certain period of time with all the projects he/she supervises.
Option 2: Export key measures as reports
If you want to process your measures further in other programs or send them to other people by e-mail, reports are particularly suitable for this purpose. You can create your own reports in Vertec that include your company logo and your CD. Report can be issued in Excel, Word or PDF formats. You decide which of your measures you want to export from Vertec for a report.

Many of our customers use the PDF format for a clear presentation, e.g. for passing on to management. If your key measures need to be processed further or the values refer to a target date, it often makes sense to use Excel. In all file formats, you can export evaluations with a view to a project, a customer or an employee (Vertec editor) from Vertec.
Option 3: Display Measures Graphically in Vertec
The new Business Intelligence Module makes it possible: It supplements the first two options with a graphical representation of your measures directly on the Vertec interface. With it, you can create bar charts or line charts (time series) and evaluate your measures.


You can freely define the periods of your evaluations. Bar charts give a quick overview of the time sequences in projects. The individual bars of a chart can be sorted in ascending or descending order in Vertec. If you show display a measure in a time series, you get a simple overview of the development, for example within a month or financial year.
Determining measures and using evaluations efficiently
You can see that Vertec offers you various options to simplify your controlling. As always, the basis for this is an inward look. Which values are most important for your company and need to be monitored, evaluated and, if necessary, compared in certain periods of time? I recommend that you first clarify these questions and then start implementing them in Vertec.
You have to decide which of the three presented options best suits your internal processes, customers and projects. Certainly, depending on the industry and area of work, it can also make sense to combine the individual options with each other. we support you and help you personally to find the best solution for your company.



The review package for future-proof Vertec installations


How to Use AI Features in Vertec with Full Sovereignty

Webinar Purchase


Give your Vertec the right flavor
Webinar Additional Features
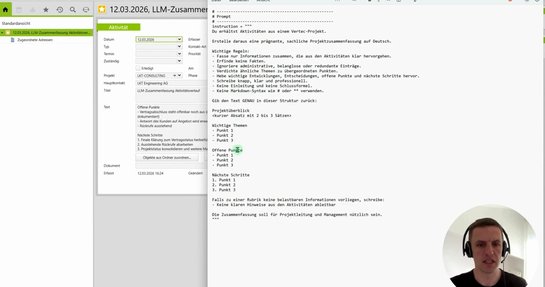
AI in Vertec: the new LLM Client in Python 3
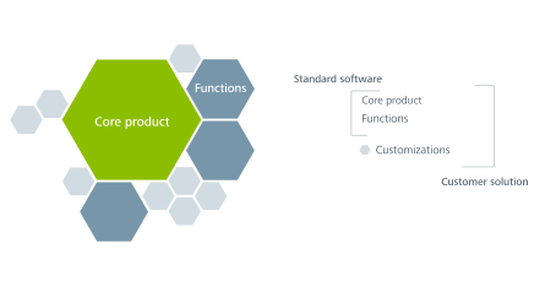
Update capability and adaptability in Vertec: a technical area of tension

